
Agent Observability and Artifacts: Traces, State Snapshots, Lineage, Cost, and Debugging
A user reports a wrong answer. You pull the trace. Every tool call succeeded, every span is green, latency is normal, and no error was logged anywhere. The…

Key topics
A user reports a wrong answer. You pull the trace. Every tool call succeeded, every span is green, latency is normal, and no error was logged anywhere. The output is still wrong.
That is the moment standard observability stops helping. Request-response tracing was built to answer what happened: which service was called, how long it took, whether it threw. An agent run fails in a different place. It fails in a decision — a plausible-looking choice made on incomplete, stale, or misassembled context. No exception fires. No span turns red. The system did exactly what it was told, and what it was told was wrong.
I have watched this pattern repeat across teams that already run agents in production. The instrumentation is not missing. The instrumentation is aimed at the wrong layer. This article builds toward one design target: reduce a failure to a (state, input, decision) triple you can re-execute at the decision boundary. That target has three honest outcomes, and conflating them is how teams end up overpromising reproducibility they cannot deliver.
- Exact replay — same model version, same inputs, same configuration, same decision. Rare outside pinned, side-effect-free steps.
- Decision replay — pinned inputs and configuration, re-executed to test whether the action selection holds. This is the practical target for most debugging.
- Forensic reconstruction — the decision cannot be re-executed, but the evidence chain explains what happened and why. This is what you fall back to when external state has moved.
If you cannot reach at least forensic reconstruction from what you captured, you do not have observability. You have a dashboard.
This assumes you already have a harness with tools, state, and execution surfaces. We are not re-explaining those layers. We are instrumenting them so a failure becomes diagnosable and, where possible, repairable.
Why Standard APM Traces Fail on Agent Runs
Classical distributed tracing assumes a bounded call graph. The service topology is known at deploy time; spans are emitted along edges that exist in the code. The span tree is a schema.
An agent's control flow is decided at runtime by the model. The span tree is data. You cannot pre-declare it, and you cannot assume the same input produces the same tree twice. This is the first structural break, and it invalidates most of the assumptions baked into APM tooling.
The second break is subtler and more expensive. Agent failures are usually not exceptions. They are decisions. The model picked tool B when the task needed tool A. It passed a stale document ID because retrieval returned yesterday's index. It summarized a tool result that had already been truncated. Each of these is a valid action on invalid context. Error-level logging will never surface them, because nothing errored.
The third break is non-determinism. "Rerun it locally" is not a debugging strategy when the same prompt produces a different trajectory on the next call. You are not chasing a bug that reproduces; you are chasing a decision that happened once, under conditions you did not record.
The failure is rarely in the code path. It is in the context that fed the decision. Capture the context or you are debugging a ghost.
To make this tractable, name the surfaces worth capturing. I use three:
| Surface | What it captures | Example signals |
|---|---|---|
| Operational | Calls, latency, errors, resource use | model call duration, tool error codes, retry counts |
| Cognitive | Prompts, decisions, tool arguments | system instructions, chosen action, reasoning output |
| Contextual | Retrieved data, environment, permissions | retrieved doc IDs, tool schemas offered, auth scope |
Most teams instrument the operational surface and call it done. The cognitive and contextual surfaces are where agent failures actually live. The rest of this article is about capturing them without drowning in data.
The Trace Schema: Runs, Spans, and Trajectories
Before writing instrumentation, fix the vocabulary. Three primitives carry the load:
- A run is one model call with its full input: system instructions, tool schemas offered, context payload, and output.
- A trace links runs into one execution — a single task from start to finish.
- A thread groups traces across turns, preserving multi-turn conversation context.
These map onto familiar tracing concepts but capture reasoning context rather than service calls. The distinction matters because the payload is different: a run's input is a prompt assembly, not an HTTP request body.
Parent-child relationships must be explicit and stable. Parallel branches and retries are the usual casualties — if a retry is recorded as a sibling rather than a child of the original attempt, your trace becomes a flat list you cannot reason about. Encode the relationship at emission time, not at query time.
Capture the decision-relevant fields, not everything. The minimum viable run record:
{
  "run_id": "r_8f2a",
  "trace_id": "t_44c1",
  "parent_run_id": "r_8f19",
  "attempt": 2,
  "model": { "id": "claude-sonnet-4-5", "version": "20250929" },
  "prompt_version": "agent-system-v17",
  "tools_offered": ["search_docs", "write_file", "send_email"],
  "context_ref": "sha256:9c1e...",
  "decision": {
    "action": "search_docs",
    "arguments": { "query": "refund policy 2024", "top_k": 5 }
  },
  "result_ref": "sha256:7b3d...",
  "tokens": { "input": 8421, "output": 213 },
  "latency_ms": 1840
}
The load-bearing detail is versioning. A trace without prompt_version and model.version cannot be replayed after a deploy — which is exactly when you need it. The prompt that produced the failure is gone; the model may have been upgraded; the tool schema may have changed. Pin all three in the record or the trace is archaeology.
Note the context_ref and result_ref fields. They are hashes, not inlined payloads. That is the next section.
Knowledge check
Check your understanding
Answer this question before you continue.
State Snapshots: What to Persist and When
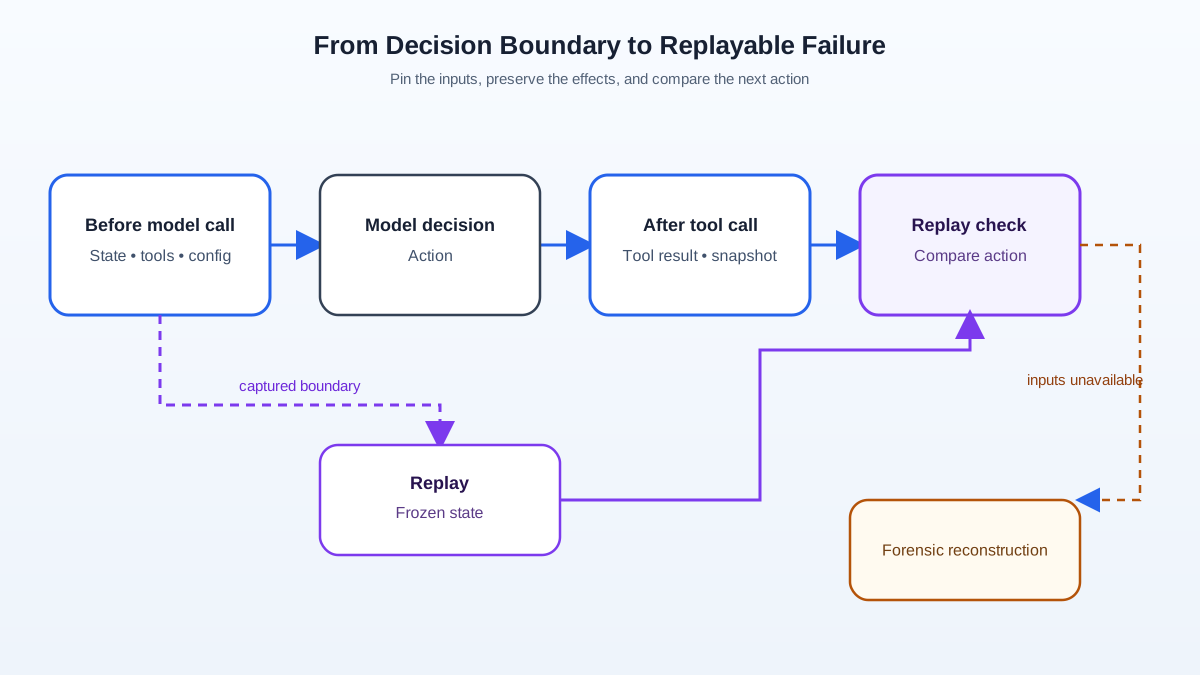
The snapshot is the difference between "we saw it fail" and "we can make it fail again." Get the boundary right or you will either store the world or store nothing useful.
Separate three kinds of state:
- Working state — in-flight context: the assembled prompt, the message history, the scratchpad.
- Checkpointed state — resumable state: enough to re-enter the loop at a given step.
- External state — files, database rows, remote resources. This lives outside the snapshot; you reference it, you do not copy it.
Only the first two belong in the snapshot. External state is referenced by identity and version, not duplicated.
But a reference is only replayable when it resolves to a stable value or a captured response. A versioned document ID, a database row, a permission scope, or a retrieval index can still change semantically between the original run and the replay. The snapshot contract must therefore record two things for every decision-relevant external input: a stable version or snapshot handle, and a captured response for anything that cannot be pinned. If the retrieval index cannot be frozen, capture the exact documents returned, not just the query.
Side-effecting tools need an explicit replay mode. Re-entering a live tool during replay can send a duplicate email, double-charge a customer, or corrupt state. Record the original result and replay against it. If the tool's behavior itself is under test, use a simulator or a guarded live call with the side effect disabled. Never let a replay path silently re-execute a side effect.
Snapshot at decision boundaries, not on a timer. Two boundaries matter: before each model call, and after each side-effecting tool call. The first captures what the model saw when it decided. The second captures what changed in the world as a result. A timer-based snapshot will miss both.
For large payloads — retrieved documents, long tool outputs — store content-addressed blobs and reference them by hash. Inlining megabytes of retrieved text into every span is how observability becomes the thing that takes down your database.
A snapshot that captures the prompt but not the tool results produces a replay that diverges immediately. The divergence is not a model problem. It is a missing input, and it will send you debugging the wrong layer for a week.
The test for a sufficient snapshot is mechanical: resume from it and compare the next decision. If the replayed run picks a different action than the original, your snapshot is incomplete. Do this deliberately, as a check, not as a hope.
Knowledge check
Check your understanding
Answer this question before you continue.
One Run, End to End
The sections above describe layers. Here is how they compose around a single run. The IDs are the ones you will reuse in the lineage code and the replay test.
{
  "trace_id": "t_44c1",
  "thread_id": "th_09b2",
  "events": [
    {
      "type": "model_run",
      "run_id": "r_8f19",
      "step": 6,
      "decision": { "action": "search_docs", "arguments": { "query": "refund policy", "top_k": 5 } },
      "context_ref": "sha256:aa01...",
      "tokens": { "input": 6100, "output": 180 },
      "latency_ms": 1420
    },
    {
      "type": "tool_result",
      "run_id": "r_8f19",
      "tool": "search_docs",
      "result_ref": "sha256:bb02...",
      "external_reads": [
        { "source": "vector_index", "snapshot": "idx_2026_09_10", "doc_ids": ["d_771", "d_882"] }
      ],
      "latency_ms": 310
    },
    {
      "type": "snapshot",
      "snapshot_id": "s_3c11",
      "run_id": "r_8f19",
      "boundary": "post_tool",
      "state_ref": "sha256:cc03..."
    },
    {
      "type": "model_run",
      "run_id": "r_8f2a",
      "parent_run_id": "r_8f19",
      "step": 7,
      "decision": { "action": "write_file", "arguments": { "path": "refund.md" } },
      "context_ref": "sha256:dd04...",
      "tokens": { "input": 8421, "output": 213 },
      "latency_ms": 1840
    },
    {
      "type": "artifact_write",
      "run_id": "r_8f2a",
      "step": 7,
      "artifact": "refund.md",
      "content_hash": "sha256:ee05...",
      "consumed_refs": ["sha256:bb02..."]
    }
  ]
}
Read the sequence as a chain of custody. Step 6 decided to search. The tool returned documents from a pinned index snapshot. A post-tool snapshot captured the state the next decision would see. Step 7 decided to write a file, and the artifact record points back to the retrieval result that fed it. Cost and latency are attached to the step that incurred them, not to the trace as a whole.
That is the whole design. Traces give you the sequence. Snapshots give you the state at each decision. Lineage gives you the edges from output back to input. Cost attribution tells you which step to look at first when the problem is expense rather than correctness.
Artifact Lineage: Connecting Outputs to Their Inputs
An artifact is any durable output: a file, a commit, a generated document, a database write, a message sent. Lineage is the edge set from artifact to producing step to consumed inputs.
Without lineage, "this file is wrong" is a dead end. With lineage, it becomes "this file was produced by step 7 from a retrieval result that was stale at step 3." That is a repairable statement.
Record producer identity for every artifact: which run, which step, which tool version, which model version, which prompt hash. The record should be emitted as a side effect of the write itself, so it cannot drift from the artifact it describes. A lineage record written by a separate process is a lineage record that will eventually lie.
def write_artifact(path, content, ctx):
    digest = content_hash(content)
    store.put(digest, content)
    lineage.emit({
        "artifact": path,
        "content_hash": digest,
        "produced_by_run": ctx.run_id,
        "produced_by_step": ctx.step_index,
        "tool_version": ctx.tool_version,
        "model_version": ctx.model_version,
        "prompt_hash": ctx.prompt_hash,
        "consumed_refs": ctx.input_refs,
    })
That synchronous emit is a deliberate tradeoff. If lineage is required for correctness or audit, the artifact's identity and minimal producer metadata belong in the same commit transaction or write protocol as the artifact itself. Asynchronous enrichment is fine for non-critical fields — tags, human labels, derived metrics — but it can lose edges on a process crash or partial write. If you go async, add explicit missing-lineage detection so a dropped edge surfaces as a gap rather than as silence.
One boundary worth stating plainly: lineage is a mechanical record of what the system did. It is not a guarantee that the output is correct. Do not let a clean lineage graph read as a correctness claim. Lineage tells you where to look; evaluation tells you whether what you found is good.
Knowledge check
Check your understanding
Answer this question before you continue.
Cost and Latency Attribution Per Step
A monthly bill tells you that agents are expensive. It does not tell you which step is expensive, which is the only version of the question you can act on.
Attribute tokens, tool calls, and wall-clock latency to the step that incurred them. Track input tokens separately from output tokens. In long trajectories, context growth is usually the dominant cost driver, not the final answer — each step re-sends a larger history, and the cost compounds quietly.
Watch for three pathological patterns:
- Repeated near-identical tool calls — the agent looping because it did not recognize a prior result.
- Retries that re-send full context — a transient failure that costs a full prompt re-assembly.
- Sub-agents duplicating work — parallel branches that each retrieve the same documents.
Set per-run and per-step budgets as first-class limits, and record when a run hits them. A budget stop is a distinct outcome from a task failure. Conflating the two hides the fact that your agent is not failing — it is running out of rope.
Treat token counts as attribution signals, not invoices. Accounting differs across providers, and caching changes the real cost. Use the numbers to localize waste, not to reconcile the bill.
From Trace to Reproducible Test Case
This is where observability pays for itself. A captured failure becomes a fixture that fails deterministically and proves the fix.
The extraction is mechanical. At the failing step, freeze the triple: state snapshot, offered tools, model config. That frozen triple is your test case.
def test_step_7_writes_from_fresh_retrieval(fixture):
    result = replay(
        state=fixture.snapshot,          # s_3c11
        tools=fixture.tools_offered,
        model=fixture.model_config,      # pinned version
        tool_results=fixture.recorded,   # sha256:bb02...
    )
    assert result.decision.action == "write_file"
    assert result.decision.arguments["path"] == "refund.md"
    assert "sha256:bb02..." in result.consumed_refs
    assert result.state_transition == "post_tool -> write"
Assert on observable predicates: the selected tool, normalized arguments, the input references the decision consumed, the state transition, and the side-effect intent. Do not assert on free-form reasoning text unless that text is itself the contract. Internal deliberation is unstable across model versions and sampling; structured action selection is what you can hold to account.
If the failure does not reproduce against the pinned versions, that is itself the finding. It means an unrecorded input is influencing the decision — a live retrieval index, an environment variable, a timestamp, a permission that changed. The non-reproduction is a signal that your snapshot is incomplete, and it points at exactly what to capture next.
Boundary: replaying a frozen step tests the decision layer, not the full system. End-to-end behavior still needs integration-level checks. Do not let a green replay suite convince you the agent works.
Knowledge check
Check your understanding
Answer this question before you continue.
Instrumentation Without Rewriting the Harness
You do not need to thread instrumentation through every agent function. Three interception points cover most of what you need:
- Wrap the model client. Every call passes through one place. Capture input, output, tokens, latency, model version.
- Wrap the tool dispatcher. Every tool invocation passes through one place. Capture arguments, results, errors, and emit lineage on writes.
- Wrap the state store. Every read and write passes through one place. Capture snapshots at decision boundaries and content-address large payloads.
Prefer an open standard for span export so you are not locked to one backend. Check what your framework already emits before building custom instrumentation — many agent frameworks expose metadata through OpenTelemetry, and observability tools build custom instrumentation on top. Do not rebuild what you already have.
Sampling strategy: capture everything in staging, sample aggressively in production, but always capture full traces for errors, budget stops, and flagged outputs. The runs you most need are the ones you cannot predict.
Redaction and retention are design constraints, not afterthoughts. Prompts and tool results routinely contain secrets and personal data. Decide what you redact and how long you keep it before you turn on capture, not after an incident.
Overhead is real. Measure the cost of instrumentation itself, and keep the write path off the critical path where possible. An observability layer that adds latency to every model call is a tax on the thing you are trying to observe.
When Observability Is Overkill
Not every agent needs a telemetry platform. State the boundary so you do not build one for a prototype.
Single-step, deterministic, low-volume calls do not need trajectory capture. Structured logs and a request ID are enough. If the agent has no durable side effects and no cost sensitivity, full lineage tracking is premature.
The trigger to invest is specific: you cannot reproduce a reported failure, or you cannot explain a cost spike. Until one of those happens, keep it thin. When one happens, you will know exactly what to build, because the gap will be staring at you.
One more boundary: do not confuse observability with evaluation. Traces tell you what happened. They do not tell you whether the output was good. You still need a scoring layer — human review, model-as-judge, or assertions — sitting on top of the traces. Observability makes failures visible and reproducible. Evaluation makes them judged.
The First Move
Pick one recent failed or expensive run. Try to reconstruct the exact state at the step where it went wrong using only what you currently capture. Do not fix anything yet. Just reconstruct.
The gap you find is your instrumentation backlog, ordered by what blocked you first. Maybe you have the prompt but not the tool results. Maybe you have the tool results but not the model version. Maybe you have everything but the retrieval index state. Each gap is a specific thing to capture, and each one is cheaper to close now than during the next incident.
The durable rule: a run is observable when a stranger can reconstruct the failing decision from captured evidence, and re-execute it at the decision boundary whenever the inputs and configuration can be pinned. Everything in this article — traces, snapshots, lineage, cost attribution — exists to make that sentence true. Build toward it one gap at a time, and the next failure stops being archaeology.
Knowledge check
Final check
Finish the article by checking the ideas you just learned.
References
Research updated Sep 11, 2026


